
Complete Guide to the Life Insurance Calculator: SBP vs Term Life vs Permanent Insurance
Introduction
One of the most important financial decisions military retirees face is how to protect their families after they're gone. The Survivor Benefit Plan (SBP) offers guaranteed income for your spouse, but is it the best option? Our Life Insurance Calculator helps you compare SBP against Term Life Insurance, Indexed Universal Life (IUL), Whole Life Insurance, and even an ETF investment strategy—all in one powerful tool.
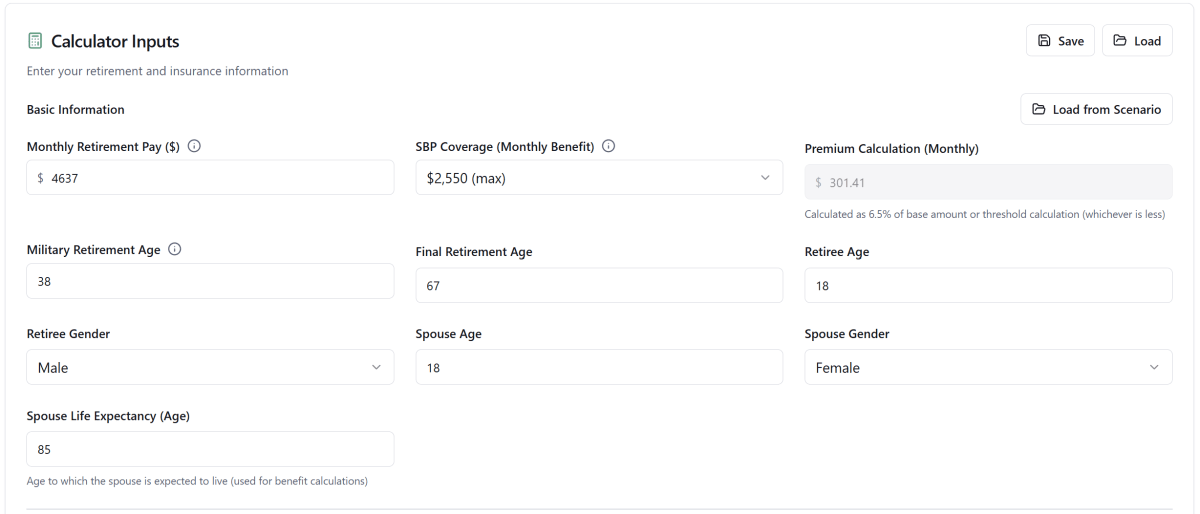

The Life Insurance Calculator dashboard provides a comprehensive view of all your insurance comparison options
Key Features at a Glance
| Feature | Description |
|---|---|
| 4-Way Comparison | Compare SBP, Term Life, IUL/Whole Life, and ETF strategies side-by-side |
| Monte Carlo Simulation | Run 100-10,000 simulations to understand potential outcomes |
| 5 Interactive Charts | Visualize costs, benefits, survivor income, break-even points, and Monte Carlo distributions |
| Health Adjustments | Factor in your health rating and smoker status for realistic premiums |
| Death Scenario Analysis | Model what happens to your family if you pass away in any given year |
| Withdrawal Planning | Model retirement withdrawals with tax implications |
| Save & Load | Save multiple scenarios for later comparison |
| Export to Excel | Download detailed year-by-year projections |
| Agent Referral | Connect with a vetted insurance professional directly from the calculator |
Getting Started: Setting Up Your Profile
Step 1: Enter Retiree Information
Start by entering your basic demographic information in the calculator inputs section:
Enter your age, gender, and retirement details
Required Fields:
- Your Age: Current age (18-100)
- Gender: Male or Female (affects mortality calculations)
- Military Retirement Age: When you plan to retire from service (35-65)
- Final Retirement Age: When you plan to stop working entirely (60-75)
- Retirement Pay: Your projected annual military retirement pay
Step 2: Enter Spouse Information
Your spouse's details are crucial for accurate benefit calculations:
- Spouse Age: Their current age
- Spouse Gender: Male or Female
- Life Expectancy: Estimated lifespan for benefit projections (50-100)
Pro Tip: Be realistic with life expectancy estimates. The Social Security Administration's life tables can help you make an informed estimate.
Step 3: Configure Health Factors
Health significantly impacts insurance premiums. The calculator adjusts term and permanent insurance premium estimates based on your profile:
- Health Rating: Standard, Preferred, or Substandard
- Smoker Status: Yes or No (smokers pay approximately 1.5x higher premiums)
Understanding the Insurance Options
Option 1: Survivor Benefit Plan (SBP)
The SBP is the military's built-in survivor benefit program. Here's how it works:
How SBP Costs Are Calculated:
Monthly Premium = 6.5% of base amount (with some thresholds)
Maximum Benefit = 55% of your retirement pay
Key SBP Settings:
- Coverage Percent: What percentage of your retirement pay to cover (0-100%)
- Automatic COLA: Benefits increase with cost-of-living adjustments
SBP Advantages:
- Guaranteed lifetime income for your spouse
- COLA-adjusted benefits
- No medical underwriting required
- Automatic deduction from retirement pay
SBP Considerations:
- Premiums paid for 30 years or until age 70 (whichever is later)
- Benefits stop if spouse remarries before age 55
- Benefits are taxable income
Option 2: Term Life Insurance
Term life provides pure death benefit protection for a specified period:

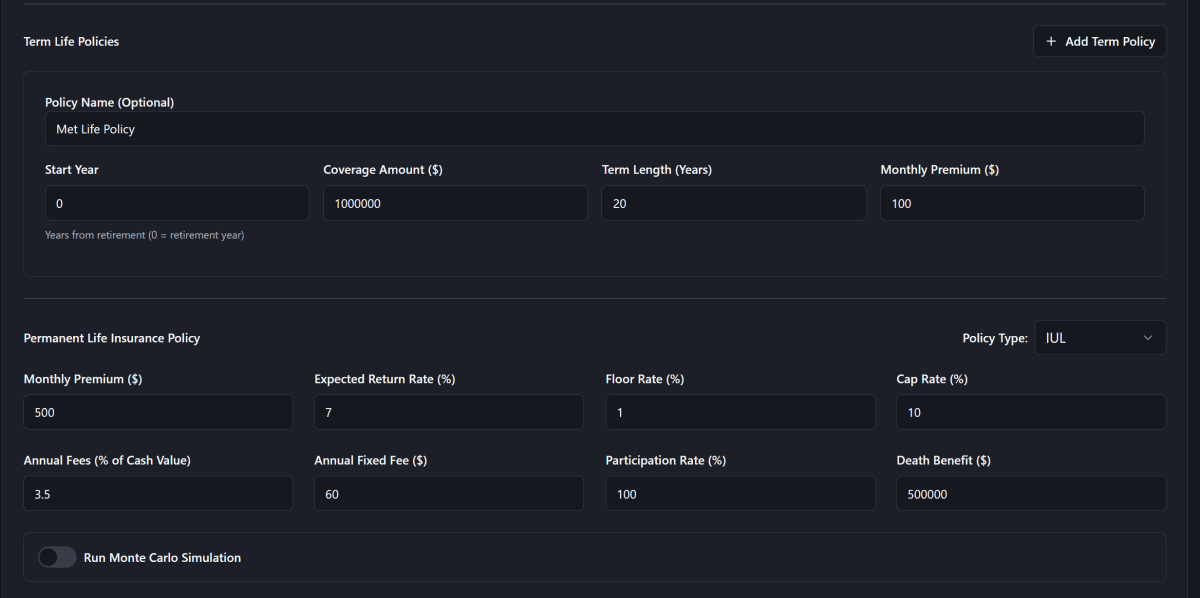
Configure term policies, permanent insurance, and Monte Carlo simulation settings
Configurable Settings:
- Start Year: When coverage begins (relative to retirement)
- Duration: 5, 10, 15, 20, 25, or 30-year terms
- Monthly Premium: Your expected premium cost
- Coverage Amount: Death benefit amount
- Policy Name: Label for identification (optional)
Adding Multiple Term Policies:
The calculator supports unlimited term policies, allowing you to create a "laddering" strategy:
| Policy | Start | Duration | Coverage | Purpose |
|---|---|---|---|---|
| Policy 1 | Year 0 | 20 years | $500,000 | Primary income replacement |
| Policy 2 | Year 0 | 10 years | $250,000 | Mortgage payoff |
| Policy 3 | Year 10 | 15 years | $200,000 | Extended coverage |
Option 3: Permanent Insurance (IUL or Whole Life)
Permanent insurance combines death benefit with cash value accumulation:
Indexed Universal Life (IUL)
IUL Parameters:
- Monthly Premium: Your premium payment
- Floor Rate: Minimum guaranteed return (0-5%, protects against market losses)
- Cap Rate: Maximum return cap (5-20%)
- Expected Return: Baseline assumption for projections
- Participation Rate: Percentage of index gains credited (50-150%)
- Annual Fees: Percentage and fixed dollar fees
- Death Benefit: Guaranteed payout amount
- Volatility: For Monte Carlo simulations
How IUL Cash Value Grows:
Cash Value = Prior Value + (Premium x 0.95) + Investment Return - Fees - Cost of Insurance
The calculator uses a sophisticated NAR-based Cost of Insurance model that accounts for the Net Amount at Risk (death benefit minus cash value).
Whole Life Insurance
Simpler than IUL with guaranteed growth:
- Guaranteed Growth Rate: Fixed annual cash value increase (0-10%)
- Lower fees typically than IUL
- Predictable cash value accumulation
Option 4: ETF Investment Strategy
What if you invested the difference between SBP costs and term premiums?

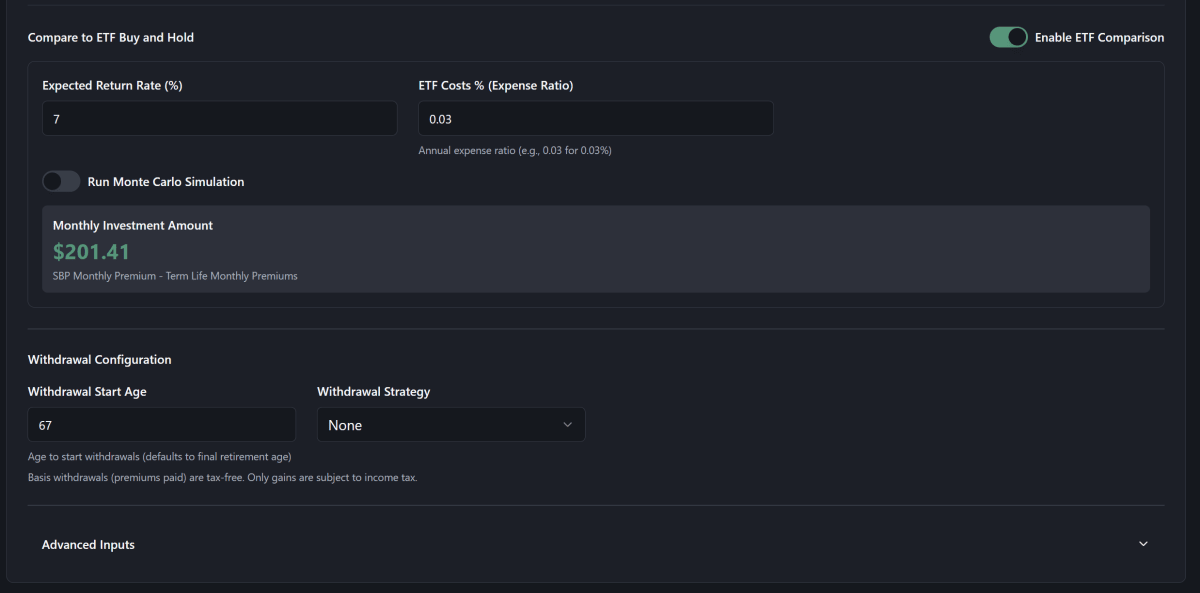
Compare insurance strategies against a self-directed investment approach
ETF Parameters:
- Expected Return Rate: Anticipated annual growth (0-15%)
- Expense Ratio: Annual ETF fees (0-2%)
- Monthly Investment: Automatically calculated as SBP premium minus term premiums
This strategy answers the question: "What if I bought cheap term insurance and invested the rest?"
Advanced Features
Monte Carlo Simulations
Don't rely on single-point projections. Run thousands of simulations to understand the range of possible outcomes:
Simulation Settings:
- Number of Simulations: 100 to 10,000 runs
- Volatility: Market volatility assumption (0-30%)
- Sequence Scenarios: Test poor returns early vs. late in retirement
Output Percentiles:
- 5th Percentile: Worst-case scenario (only 5% of outcomes are worse)
- 25th Percentile: Below-average outcome
- 50th Percentile (Median): Middle outcome
- 75th Percentile: Above-average outcome
- 95th Percentile: Best-case scenario
Sequence of Returns Testing:
| Scenario | Description | Use Case |
|---|---|---|
| Normal | Random returns throughout | Baseline projection |
| Poor Early | Reduced returns in first N years | Test retiring into a bear market |
| Poor Late | Reduced returns in final N years | Test market crash near end of life |
Withdrawal Configuration
Model how you'll access cash value in retirement:
Withdrawal Strategies:
- None: No withdrawals (pure death benefit focus)
- Percentage: Withdraw X% of cash value annually
- Fixed Amount: Withdraw a fixed dollar amount each year
Tax Considerations:
- Withdrawals are taxed on gains only (FIFO basis accounting)
- Configure your expected tax rate (0-50%)
- Calculator tracks basis vs. gains separately
Death Scenario Analysis
Ask "what if" questions with interactive scenario modeling:


Model what happens if the retiree passes away in a specific year
Scenario Analysis Shows:
- Beginning balance of investments/cash value
- Investment growth that year
- Survivor withdrawals (with optional inflation adjustment)
- Ending balance
- Years until fund depletion
Understanding the Comparison Charts
The calculator includes five interactive chart types to help you visualize the tradeoffs.
Cost Comparison Chart
Tracks the total money spent on premiums over time:
- SBP Costs: Cumulative premiums paid to the military
- Term Costs: Total term insurance premiums
- Permanent Costs: IUL or Whole Life premiums
- ETF Contributions: Money invested in the ETF strategy
What to Look For:
- Crossover points where one strategy becomes more expensive
- Total lifetime cost comparison
Death Benefit Chart
Shows the total benefit available if you pass away in any given year:
- SBP: Present value of lifetime survivor income
- Term + Cash Value: Combined death benefits
- ETF + Term: ETF balance plus any active term coverage
Toggle Between:
- Present Value (PV): Inflation-adjusted dollars
- Future Value (FV): Nominal dollars
Survivor Income Chart

See how much annual income each strategy provides your survivor
Critical for understanding quality of life for your surviving spouse:
- Annual withdrawal capacity from each strategy
- Years until funds run out (depletion analysis)
- 4% rule benchmark comparison
Break-Even Analysis
Shows net benefit (benefit minus cost) for each strategy:
- Identifies the years when each strategy "wins"
- Helps answer: "How long do I need to live for SBP to be worth it?"
Monte Carlo Distribution Chart
When Monte Carlo simulations are enabled, a fifth chart shows the probability distribution of outcomes:
- Shaded confidence bands from 5th to 95th percentile
- Median outcome line for each investment strategy
- Visual comparison of downside risk across approaches
Results Table
For detailed year-by-year analysis:
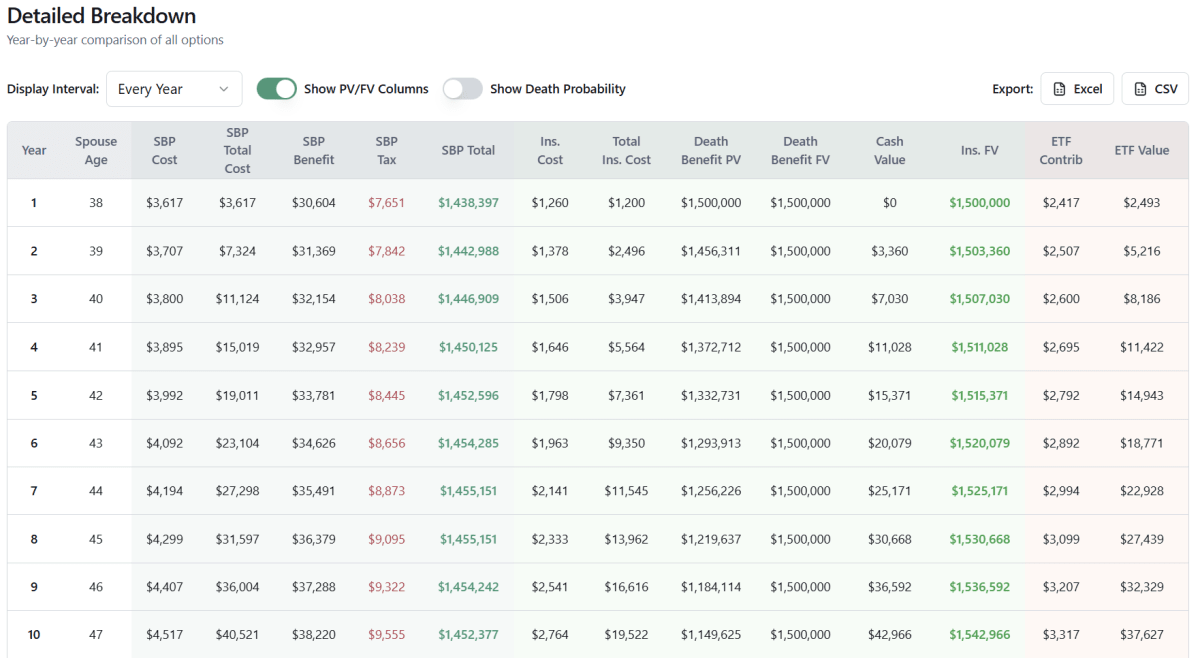
Comprehensive year-by-year breakdown of all metrics
Table Features:
- Configurable intervals: Every 1, 2, 5, or 10 years
- Toggle columns: Show/hide different metrics
- Death probability: See mortality risk by year
- Export to Excel: Download for offline analysis
Key Columns:
| Column | Description |
|---|---|
| Year/Age | Time period and retiree age |
| SBP Cost | Cumulative SBP premiums |
| SBP Benefit | Total survivor income from SBP |
| Term Cost | Cumulative term premiums |
| Cash Value | IUL or Whole Life cash value |
| Death Benefit | Current total death benefit |
| ETF Value | ETF portfolio balance |
| Death Prob | Probability of death that year |
Saving and Loading Calculations
Save Your Work
- Click Save Calculation
- Enter a descriptive name (e.g., "Aggressive Term Strategy")
- Access saved calculations anytime from your dashboard
Load Previous Calculations
Compare different scenarios by loading saved calculations:
- View in read-only mode to prevent accidental changes
- Duplicate to create variations
- Delete calculations you no longer need
Agent Referral Feature
Need personalized advice? Connect with a qualified insurance professional:
How It Works:
- Click Connect with an Agent
- Fill out the referral form:
- Name and contact information
- Brief message about your needs
- Consent to be contacted
- A qualified agent will reach out to discuss your specific situation
Step-by-Step: Running Your First Comparison
Quick Start Guide
-
Enter Basic Info
- Fill in your age, spouse's age, and retirement pay
- Set your health rating
-
Configure SBP
- Set your desired coverage percentage
- Review the calculated monthly premium
-
Add Term Insurance
- Click "Add Term Policy"
- Enter a 20-year term with comparable coverage
- Input an estimated premium (use online quote tools)
-
Configure Permanent Insurance
- Choose IUL or Whole Life
- Enter expected premium and growth assumptions
-
Review Charts
- Scroll to the five comparison charts
- Analyze cost vs. benefit tradeoffs
-
Run Monte Carlo
- Click "Run Simulation"
- Review probabilistic outcomes across percentiles
-
Explore Scenarios
- Use the death scenario tool
- Ask "What if I pass away in year 15?"
-
Save Your Analysis
- Click Save to preserve your work
- Create multiple scenarios for comparison
Common Questions Answered
"Is SBP worth it?"
It depends on your specific situation. The calculator helps you see:
- How long you need to live for SBP to "pay off"
- Whether private insurance provides better value
- The risk/reward of self-insuring with investments
"What if my spouse outlives the projections?"
SBP provides lifetime income—a significant advantage over strategies that can deplete. Use the death scenario tool to model what happens if funds run out.
"Should I ladder term policies?"
Term laddering can reduce costs while maintaining coverage. The calculator lets you model multiple overlapping policies to find the optimal mix.
"How reliable are IUL projections?"
IUL returns are uncertain. Always run Monte Carlo simulations and pay attention to the 5th and 25th percentile outcomes—these show what happens if returns disappoint.
Pro Features
Upgrade to Pro for additional capabilities:
- Unlimited saved calculations
- PDF export of comparison reports
- Advanced Monte Carlo with custom scenarios
- Priority support for complex questions
Conclusion
The Life Insurance Calculator transforms a complex decision into a clear, data-driven analysis. Whether you're leaning toward SBP's guarantees, the flexibility of term insurance, or the cash value growth of permanent policies, this tool helps you understand the tradeoffs.
Remember: This calculator is for educational purposes. Consult with a qualified financial advisor or insurance professional before making final decisions about your survivor benefits.
Additional Resources
- Insurance Needs Calculator - Determine how much coverage you actually need using the DIME method
- Retirement Pay Calculator - Estimate your military retirement pay
- State Tax Guide - Understand state tax implications for retirees
Model it yourself
See what these numbers mean for your retirement
Run your grade, years of service, and retirement date through the calculator — in about a minute.
Open the calculator — free →This article is educational and not financial, tax, or legal advice. Figures are estimates and subject to change — verify details with official sources before making decisions.
Last updated January 30, 2026. Questions? Contact us or browse more guides.